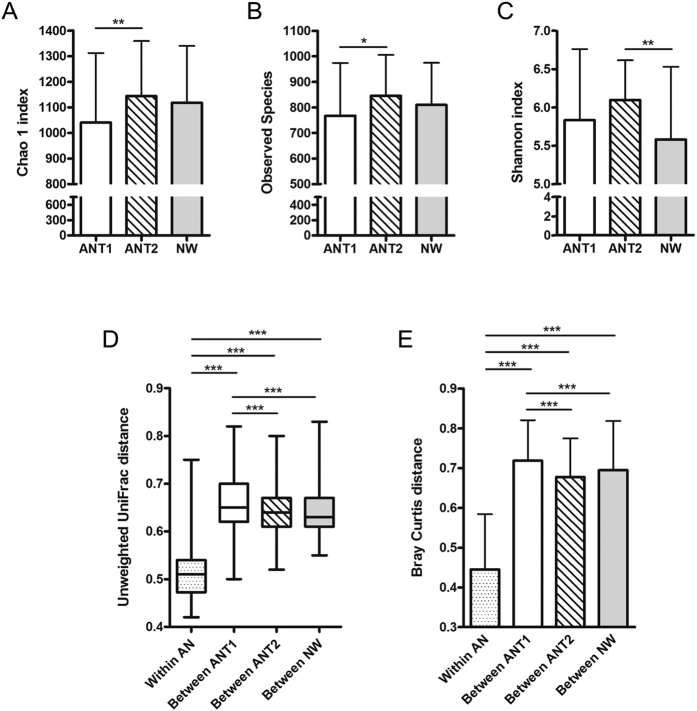
Figure 5. Alpha and beta diversity metrics in anorexia nervosa patients (AN) before (T1) and after (T2) weight gain compared to normal-weight participants (NW).
The number of observed OTUs (A), Chao 1 index (B) and Shannon index (C) for all groups are shown. The p-values of all metrics were Bonferroni adjusted. A p < 0.05 was considered as statistically significant. *Indicates a p < 0.05 and **indicates a p < 0.01. Unweighted UniFrac (D) and Bray Curtis (E) distances were calculated within AN subjects (average pairwise distance in microbiota composition between samples of the same AN patient at T1 and T2) and between subjects (average pairwise distance between samples of different subjects) for the AN groups at T1 and T2 and for the NW group, respectively. A p-value < 0.001 was considered as statistically significant. ***Indicates a p < 0.001.

