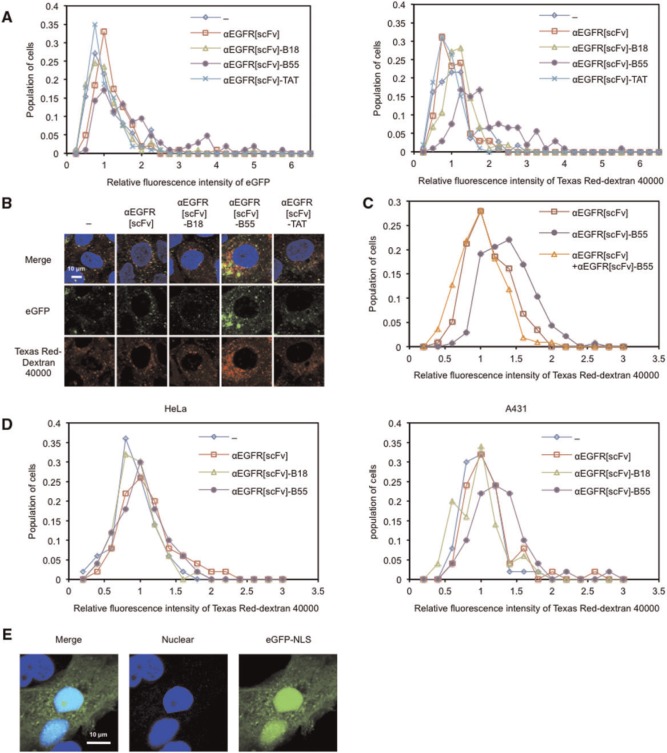
Fig. 4.
Intracellular uptake of eGFP in the presence of αEGFR[scFv]-B55. Cell-population histograms of eGFP (left panel) and Texas Red (right panel) fluorescence for each cell (A) and Confocal microscopic images (B) of A431 cells treated for 24 h with 20 µM eGFP (green) and Texas Red-conjugated dextran (M.W. 40,000) (red), 1 µg/ml Hoechst 33342 (blue) and 300 nM of each αEGFR[scFv] fusion protein. Relative fluorescence intensities were normalized with respect to the averages of the samples without scFv (‘−’) in each experiment. N = 101–111. (C) Cell-population histograms of Texas Red fluorescence for each cell of A431 cells treated for 24 h with 20 µM Texas Red-conjugated dextran (M.W. 40,000), 1.5 µM αEGFR[scFv] and/or 300 nM αEGFR[scFv]-B55. N = 110–136. (D) Cell-population histograms of Texas Red fluorescence for each cell of HeLa (left panel) and A431 (right panel) cells treated for 24 h with 20 µM Texas Red-conjugated dextran (M.W. 40,000) and 300 nM of each αEGFR[scFv] fusion protein. N = 50. (E) Confocal microscopic images of A431 cells treated for 24 h with 20 µM eGFP-NLS (green), 1 µg/ml Hoechst 33342 (blue) and 300 nM αEGFR[scFv]-B55.

