Figure 5.
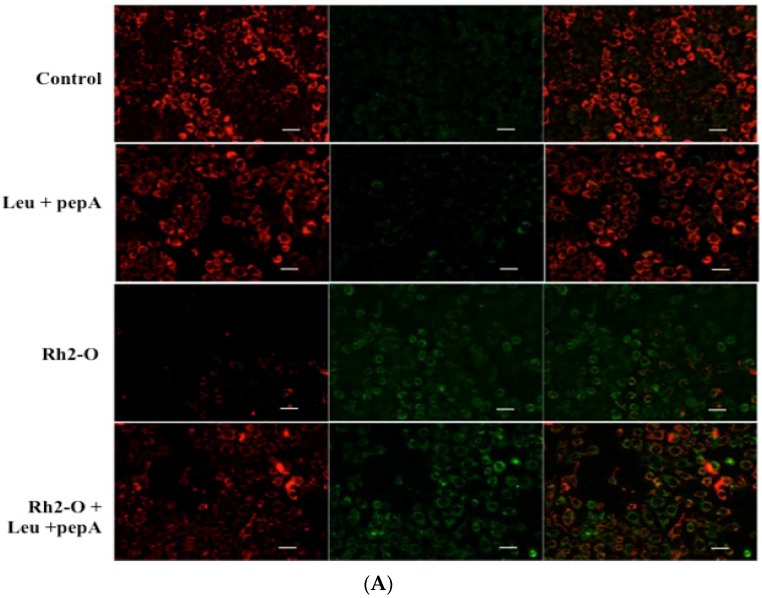
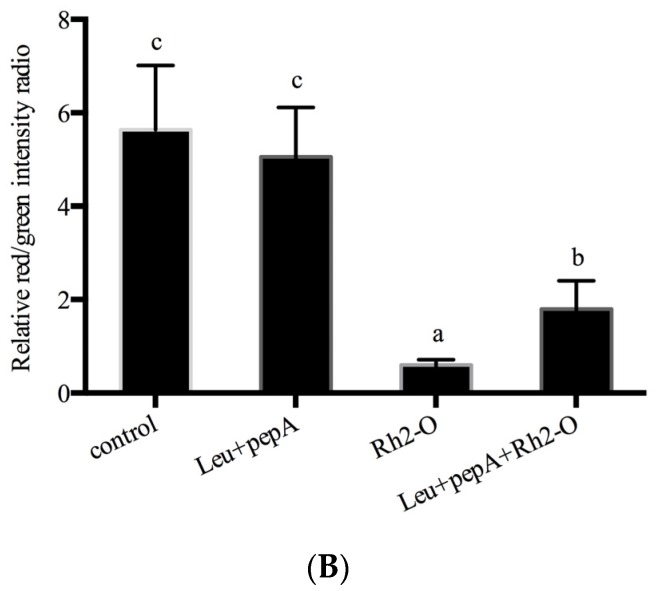
The decline of mitochondrial membrane potential (Δφm) stimulated by Rh2-O exposure in HepG2 cells. (A) After Rh2-O treatment with or without cathepsin inhibitor for 24 h, the levels of Δφm were detected by fluorescence microscope. The scale bar is 20 μm; (B) The relative red/green fluorescence intensity ratio in HepG2 cells after different treatments. Results are presented as mean ± SD of three separate experiments. Bars with different letters are significantly different from each other (p < 0.05).


