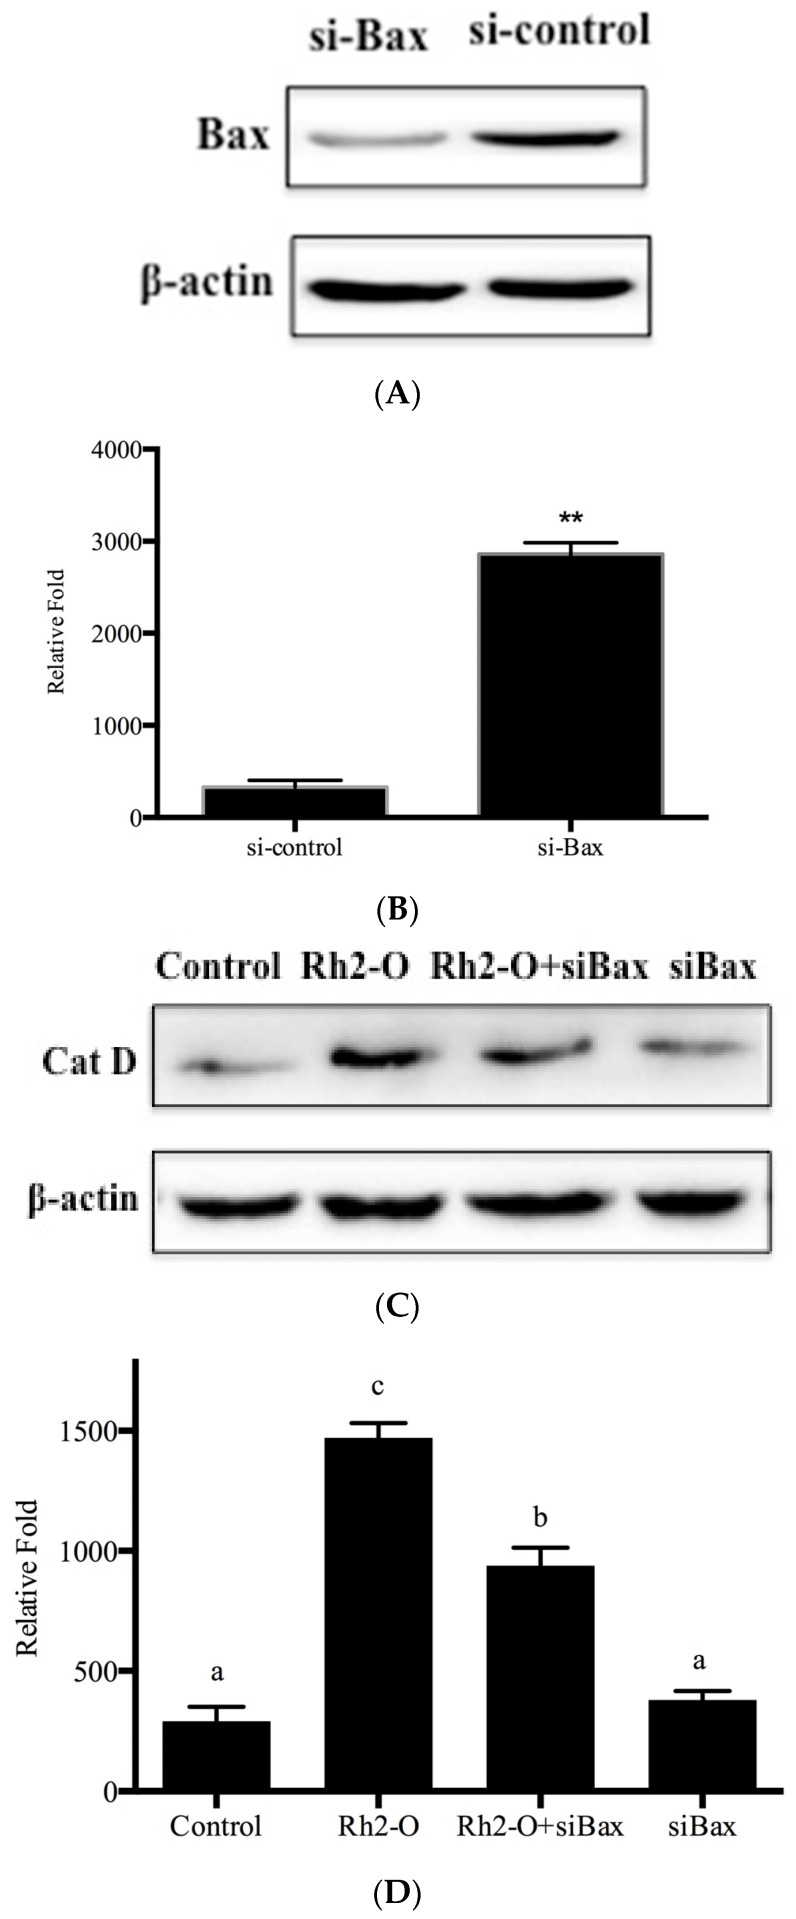
Figure 7.
Effect of siBax on the release of Cat D. (A) Western blot analysis for determining Bax levels in HepG2 cells with or without knockdown of Bax; (B) Histogram represents quantification of Bax protein levels in HepG2 cells with or without knockdown of Bax. Results are presented as mean ± SD of three separate experiments. ** p < 0.005 vs. si-control group; (C) Western blots analysis for determining Cat D protein levels in cytosol after indicated treatment; (D) Histogram represents quantification of Cat D protein levels in Rh2-O-stimulated HepG2 cell samples with or without knockdown of Bax using Image J64 software (level of control cells/β-actin defined as 1). Results are presented as mean ± SD of three separate experiments. Bars with different letters are significantly different from each other (p < 0.05).

