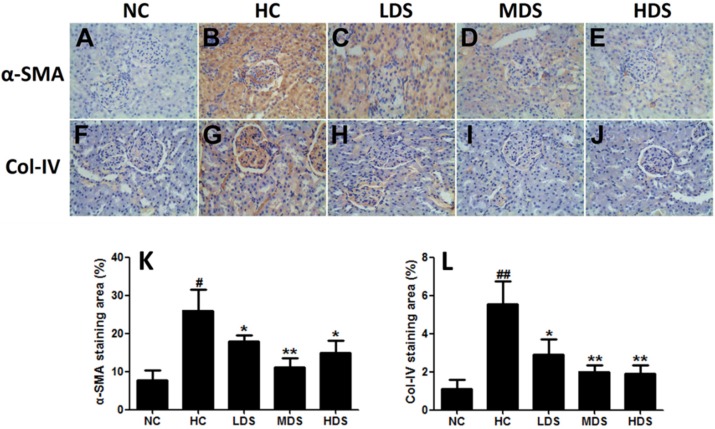
Figure 4.
Immunohistochemical staining of α-SMA (A–E) and Col-IV (F,G) expression of renal sections in the NC group (A,F) HC group (B,G) LDS group (C,H) MDS group (D,I) and HDS group (E,J) (magnification ×400). Quantification of α-SMA (K) and Col-IV (L) staining, evaluated with Image-Pro Plus software (Media Cybernetics, Silver Springs, MD, USA). # p < 0.05, ## p < 0.05 compared with the NC group; * p < 0.05, ** p < 0.01 compared with the HC group.

