Figure 3.
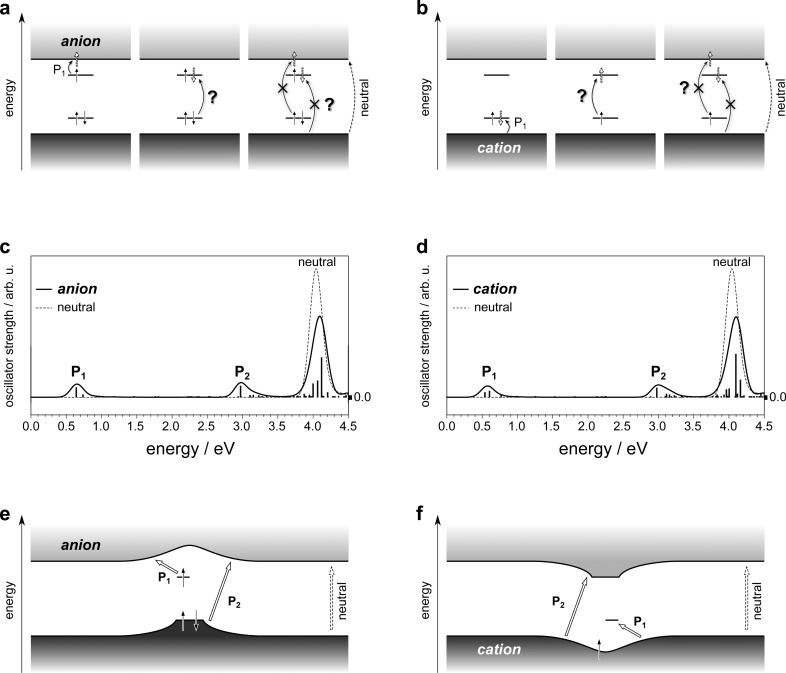
Historical and revised assignment of charge-induced optical transitions in conjugated polymers. (a) Dark- and light-gray shaded boxes indicate the valence and conduction bands, respectively. Straight, solid, and vertical arrows signify electrons with according spin. Straight, dashed, and empty arrows highlight where electrons are promoted to following the optical excitations indicated by curved arrows. The lowest-energy absorption is labeled P1, question marks near optical transitions underline that they are no longer possible in the revised picture based on Figure 2, and they are crossed out if their observability has been questioned in the literature.26,29−31 The fundamental absorption of the neutral polymer is indicated on the far right. (b) Same as (a) for the cation. (c) TDDFT-calculated absorption spectra of the negatively charged (solid line) and the neutral oligomer (dashed line). The individual transitions contributing to the anion spectrum are indicated by vertical bars at the respective transition energies with their height reflecting the respective oscillator strength in arbitrary units (arb. u.). (d) Same as (c) for the cation. (e) Schematic of the charged-induced energy levels and resulting optical transitions in polymer anions according to the revised picture proposed in the present work. (f) Same as (e) for cations.

