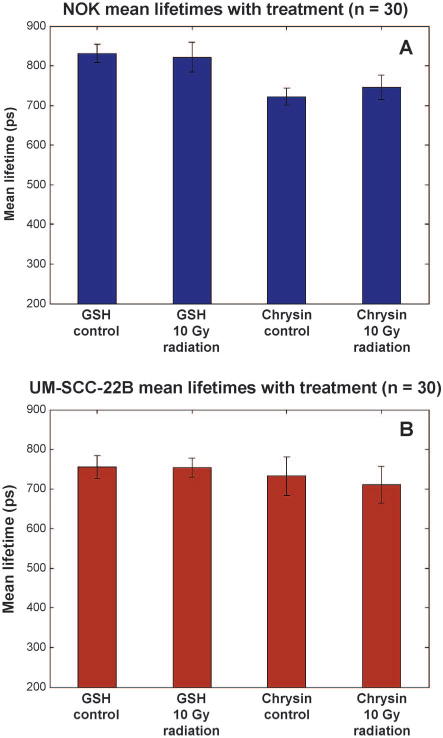
FIG. 5.

Collected τm values for NOK cells (panel A, blue) and UM-SCC-22B cells (panel B, maroon) with control treatments and treatments plus radiation (n = 30). Error bars shown are standard deviations of each treatment group. Note the consistency of the values between each treatment group.
