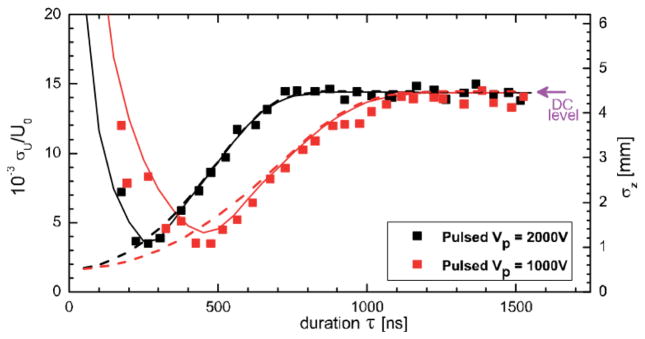
FIG. 12.
Relative energy spread σU as a fraction of the beam energy U0 for 87Rb+ pulses extracted from a photoionized MOT. Energy spread is plotted vs duration of the voltage pulse used to extract the ions for two different voltages, showing that a spread significantly smaller than the DC level can be obtained by choosing an appropriate pulse duration. Particle tracking simulations with Coulombic interactions are depicted as solid curves; simulations without Coulombic interactions as dashed curves (from Ref. 153).

