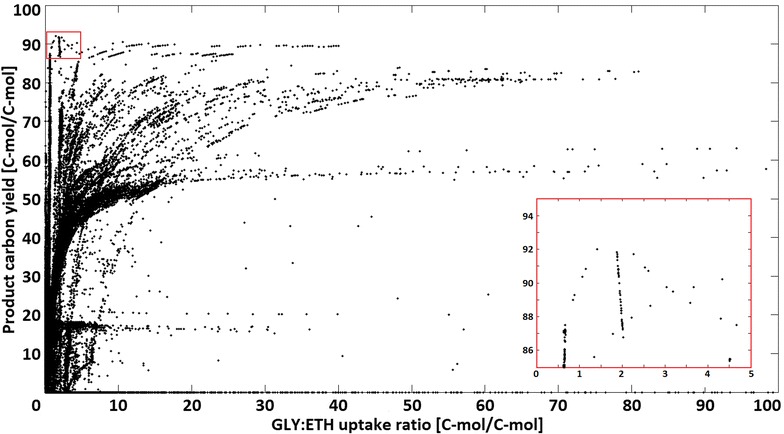
Fig. 4.

Distribution of pABA yields in dependence of the glycerol to ethanol ratio in elementary flux modes in a window with a GLY:ETH ratio ≤100 [C-mol/C-mol]. Each point in the chart corresponds to the specific product carbon yields [%] and substrate ratio of the respective elementary flux mode. The insert at the bottom right corner is a magnification of the area in the top left corner where the modes with the highest yields are located
