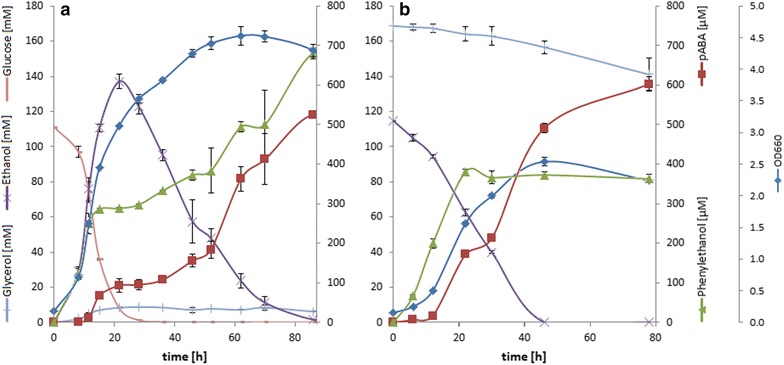
Fig. 6.

Time course of substrate consumption and product formation of biomass main aromatic products on GLC (a) and GLY/ETH (b). Titers are corrected for evaporation of H2O to reflect comparable metabolite concentrations. Carbon sources were 20 g/L glucose (initial 0.666 C-mol, of which 0.615 were consumed) in (a) and 15 g/L ethanol + 5 g/L glycerol (initial 0.722 C-mol, of which 0.225 were consumed) in (b). Biomass is reflected by means of the OD at 660 nm. Growth rates in the exponential phase were µ = 0.2242 h−1 on glucose and µ = 0.1081 h−1 on glycerol/ethanol
