Fig. 1.

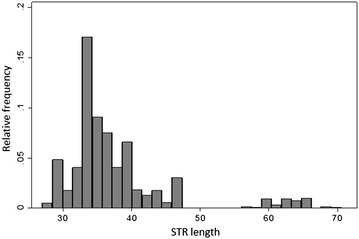
Histogram showing the bimodal distribution of EIG121 STR lengths across all three cohorts (breast cancer, endometrial cancer and healthy control samples)

Histogram showing the bimodal distribution of EIG121 STR lengths across all three cohorts (breast cancer, endometrial cancer and healthy control samples)