Fig. 2.

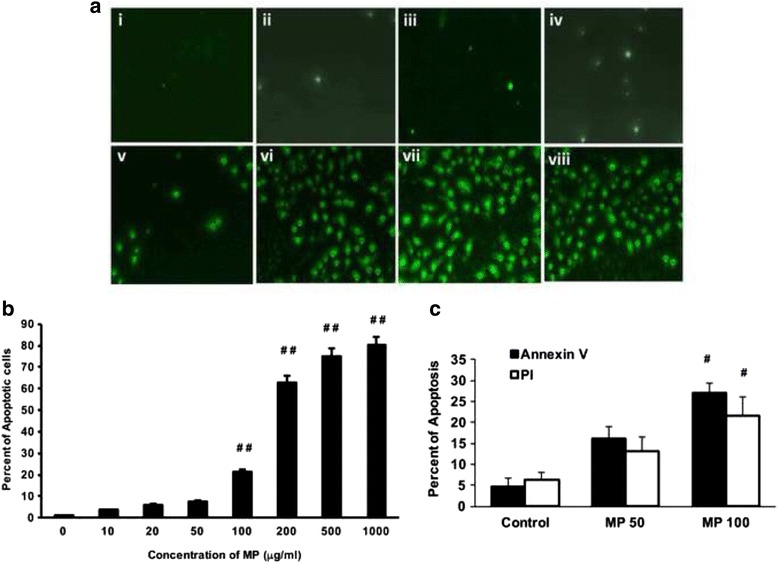
Huh-7 cells were cultured in 6-well plates and incubated with different concentrations of MP. a The cells were incubated with different concentration of MP for 24 h and TUNEL assay was performed. The pictures are representative from three different experiments. (i) untreated control cells, and (ii) 10 μg/ml, (iii) 20 μg/ml, (iv) 50 μg/ml, (v) 100 μg/ml, (vi) 200 μg/ml, (vii) 500 μg/ml and (viii) 1000 μg/ml of MP. b The positive cells were counted in at least 10 different high power fields in three different experiments and the average was plotted as percent of control (n = 3; ## p < 0.01). c To confirm the induction of apoptosis, cells were incubated with two different concentrations of MP (0, 50 and 100 μg/ml). The cells were collected and Annexin V and PI exclusion assays were performed using Flow cytometry and the percent of apoptosis was calculated (n = 3; # p < 0.05)
