Fig. 3.

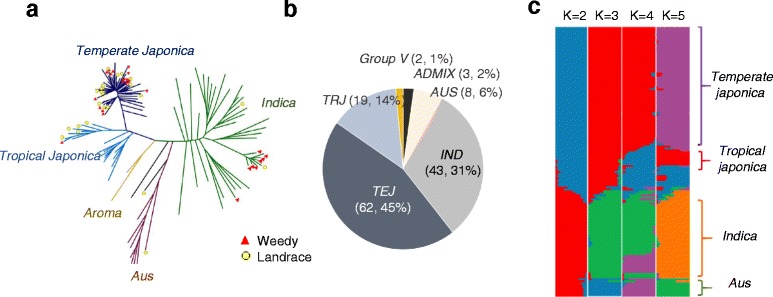
Population structure of KRICE_CORE. a Neighbor-joining analysis among KRICE_CORE using 2,046,529 HQSNPs. Landraces and weedy accessions are denoted as red triangles and yellow circles in the tree, respectively. b Pie graph designating the proportion of each subgroup. c Population structure analysis using FRAFFE. Each color represents one population. Each accession is represented by a horizontal bar, and the size of each colored segment in each horizontal bar represents the proportion contributed by ancestral population. K value represents the number of assumed clusters or populations
