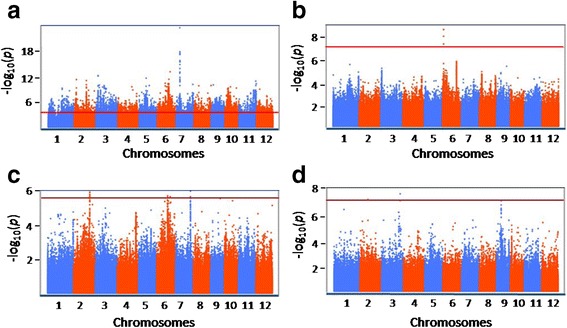
Fig. 5.

Genome-wide association studies of ‘pericarp color’ (a), ‘amylose content’ (b), ‘rice seed protein content’ (c), and ‘number of panicles per plant’ (d). Manhattan plots of the linear (for a) or mixed linear model (for b–d) are shown from negative log10-transformed P-values, which are plotted against the positions on each of the twelve chromosomes. A red horizontal line indicates the genome-wide significance threshold
