
Fig. 2.
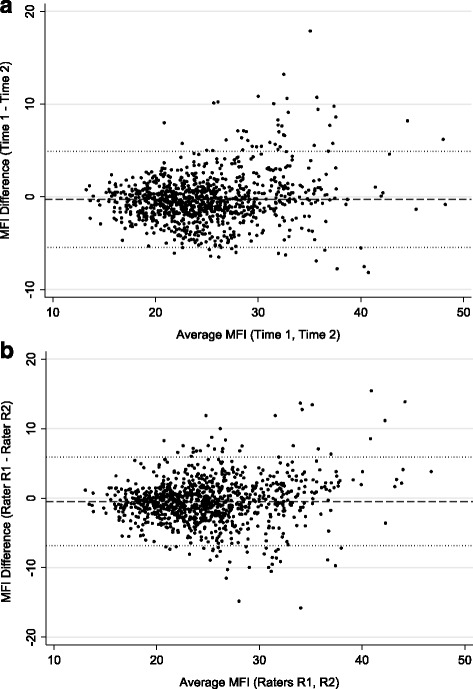
a Bland Altman plot for intra-rater reliability (where R1&R2 are combined). Footnote: Average muscle fatty infiltration (MFI %) of the two repeat observations (Time 1&2; x-axis), and the difference between MFI % values for each observation (y-axis). b Bland Altman plot for inter-rater reliability. Footnote: Average muscle fatty infiltration (MFI %) of the two raters (x-axis) versus the difference between MFI % values for each rater (y-axis)