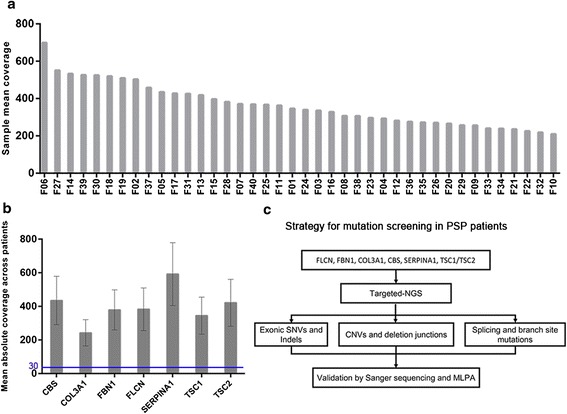
Fig. 1.

Representative Quality metrics of the targeted-NGS method and strategy for mutation screening in the targeted genes. a Representation of the average depth of each sample. The coverage depth was >200× for each sample. b Mean coverage obtained for the different genes across patients. Bar chart displaying the mean coverage of each gene in all samples. Error bars represent standard deviation. The blue line shows the lower limit of coverage appropriate to perform CNV analysis (30×). c Strategy for comprehensive mutation screening of the targeted genes in PSP cohort
