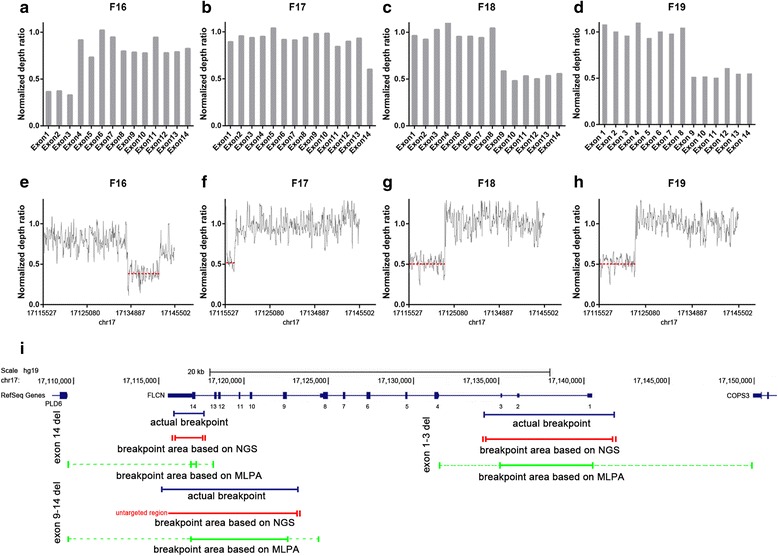
Fig. 2.

Detection of copy number variants and mapping of deletion junctions. a-d Representation of the normalized depth ratio of each exon in FLCN gene. Exons with a normalized coverage ratio below 0.7 were classified as heterozygously deleted. e-h Representation of the normalized depth ratio of 20-bp intervals in FLCN gene. The red dotted lines represent the average ratio of the deletion area. i The upper panel shows genomic structure of the FLCN gene (data from USCS database). The blue line represents actual deletion size. Deletion size of NGS-based and MLPA-based methods are represented by green line and red line, respectively. The solid line represents the definite deletion size determined by each method. Interval of vertical bars on each side of solid lines represent the range of probable deletion junctions
