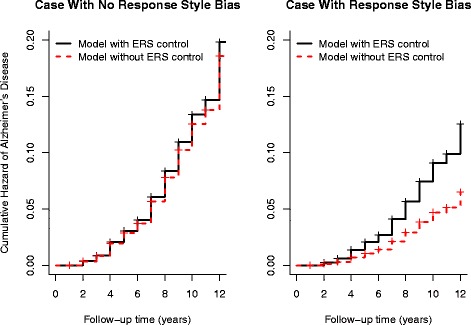
Fig. 2.

Cumulative hazard for the risk of incident Alzheimer’s disease (AD) for two cases in the sample. The first graph illustrates the cumulative hazard for an individual with a ‘non-extreme’ response pattern across scales using estimates of Neuroticism obtained from the multidimensional nominal response model (MNRM) adjusted (solid lines) and not adjusted (dotted lines) for extreme response style (ERS). The second graph shows the cumulative hazard for a second individual with an extreme response pattern using MNRM models controlling and not controlling for ERS effects
