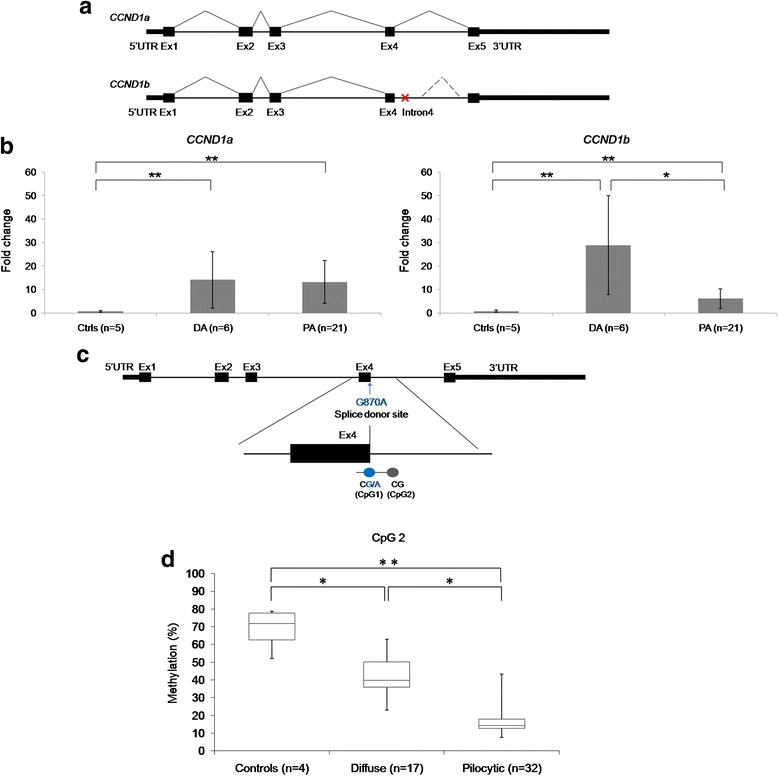
Fig. 6.

Analysis of AP-1 transcription factors and the AP-1 target gene CCND1. a Diagram showing the CCND1a transcript and the oncogenic splice variant CCND1b. Alternative splicing at the exon4-intron 4 boundary leads to the CCND1b transcript that contains intron 4, with loss of the post-transcriptional regulatory domain of exon 5 and 3’UTR. A stop codon (shown by the red cross) within the intron leads to truncated cyclin D1 protein. b Expression levels of CCND1a and CCND1b in controls, pilocytic and diffuse astrocytomas (Error bars show the standard deviation for the average beta value for each tumour group). c Diagram of CCND, showing the location of SNP rs9344 (G870A) within a CpG at the splice site (CpG1) and its neighbouring CpG site within the intron (CpG2). d CpG2, the closest intronic CpG site to the SNP, shows lower methylation levels in the low-grade astrocytomas compared to normal brain controls (differential change >30 %; Mann-Whitney U-test- ** p-value <0.01, * p-value <0.05)
