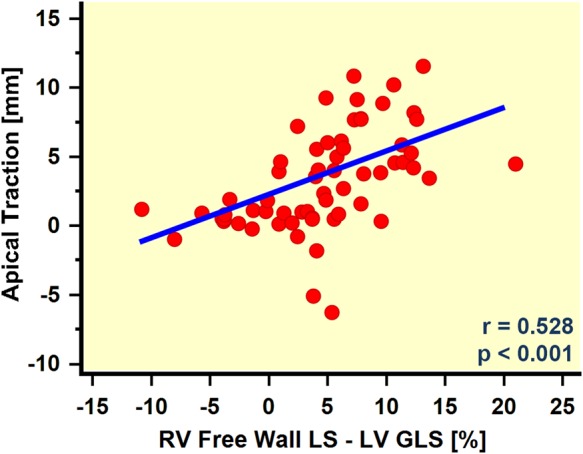
Figure 3.

Scatter plot of the apical traction amplitude in relation to the difference between RV and LV function as measured by RV free-wall GLS and LV GLS. The regression analysis revealed a significant correlation, suggesting a relation between AT and the imbalance in RV and LV function.
