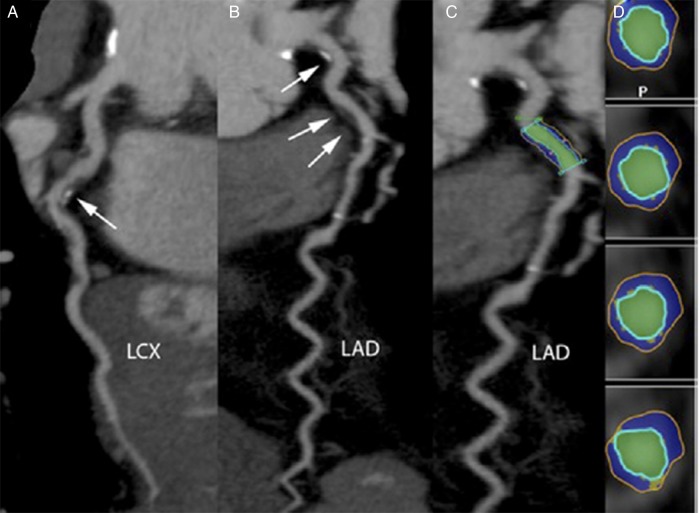
Figure 7.
Evaluation of coronary plaques with computed tomography. Example of a 64-year-old man presenting with non-ST-segment elevation myocardial infarction. The culprit lesion is seen in the proximal part of the left circumflex artery (LCX) (white arrow). This lesion has both calcified and non-calcified components (A). Additional non-obstructive plaques are found in the left main (single arrow) and proximal left anterior descending (LAD) artery (double arrow) (B). The plaque analysis tool applied to the lesion in a curved multiplanar reconstruction (C) and transverse sections (D). The blue colour represents NCP and yellow, calcifications. With the permission of publisher Elsevier Inc. Previously published in JACC 2011;58:502–9 by Kristensen et al.

