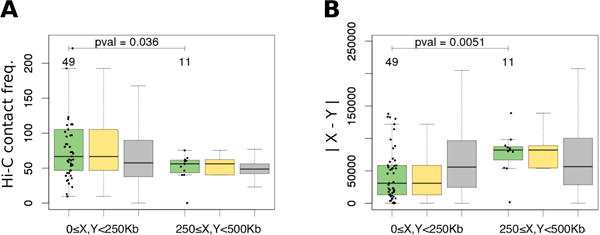
Fig. 2.

Spatial distance between genes X and Y with a predicted rearrangement event (green boxplots), bootstrapped rearrangements (yellow boxplots) and control gene pairs (gray boxplots) in S.cerevisiae, measured as (A) Hi-C contact frequency and (B) |X − Y| estimated via the linear distance to the centromere. Three left boxplots show genes located near centromere (0≤X<250Kb and 0≤Y<250Kb); three right boxplots show genes located at a distance from centromere (250≤X<500Kb and 250≤Y<500Kb). All boxes show quartiles and the median of the data, the whiskers extend to the minimum and maximum data values located within 1.5 interquartile range from the box. The numbers above the boxplots show the number of observations in the boxplots and the Wilcoxon test p-values between regions of aligned or not aligned chromosomal arms (two green boxplots).
