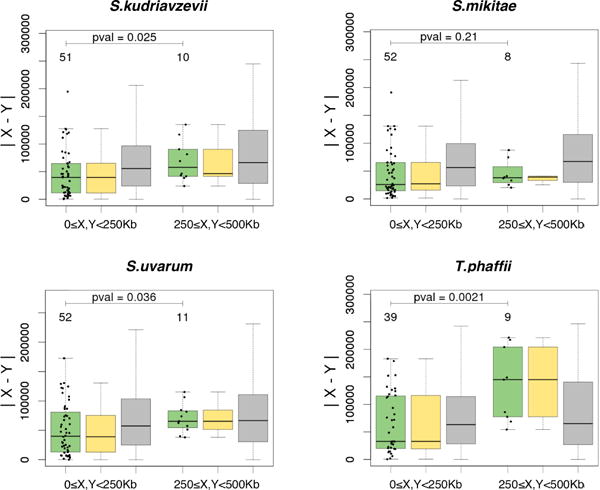
Fig. 3.

The distance |X − Y| estimated via the linear distance to the centromere for genes X and Y with a predicted rearrangement event (green boxplots), bootstrapped rearrangements (yellow boxplots) and control gene pairs without rearrangements (gray boxplots). Panels demonstrate different yeast species. Notations are as in Fig. 2.
