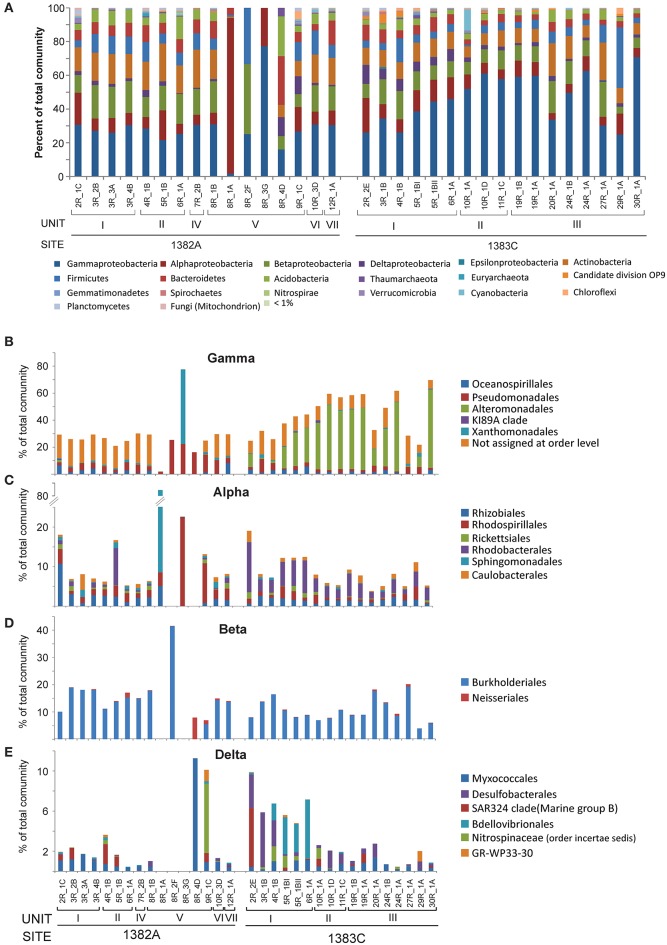
Figure 2.
Relative abundance of taxonomic groups. (A) Class level abundances of Proteobacteria and phylum level for all other groups comprising more than 1% of total community in one or more samples. Abundances for the taxonomic orders representing more than 1% of total community of (B) Gammaproteobacteria, (C) Alphaproteobacteria, (D) Betaproteobacteria, and (E) Deltaproteobacteria.

