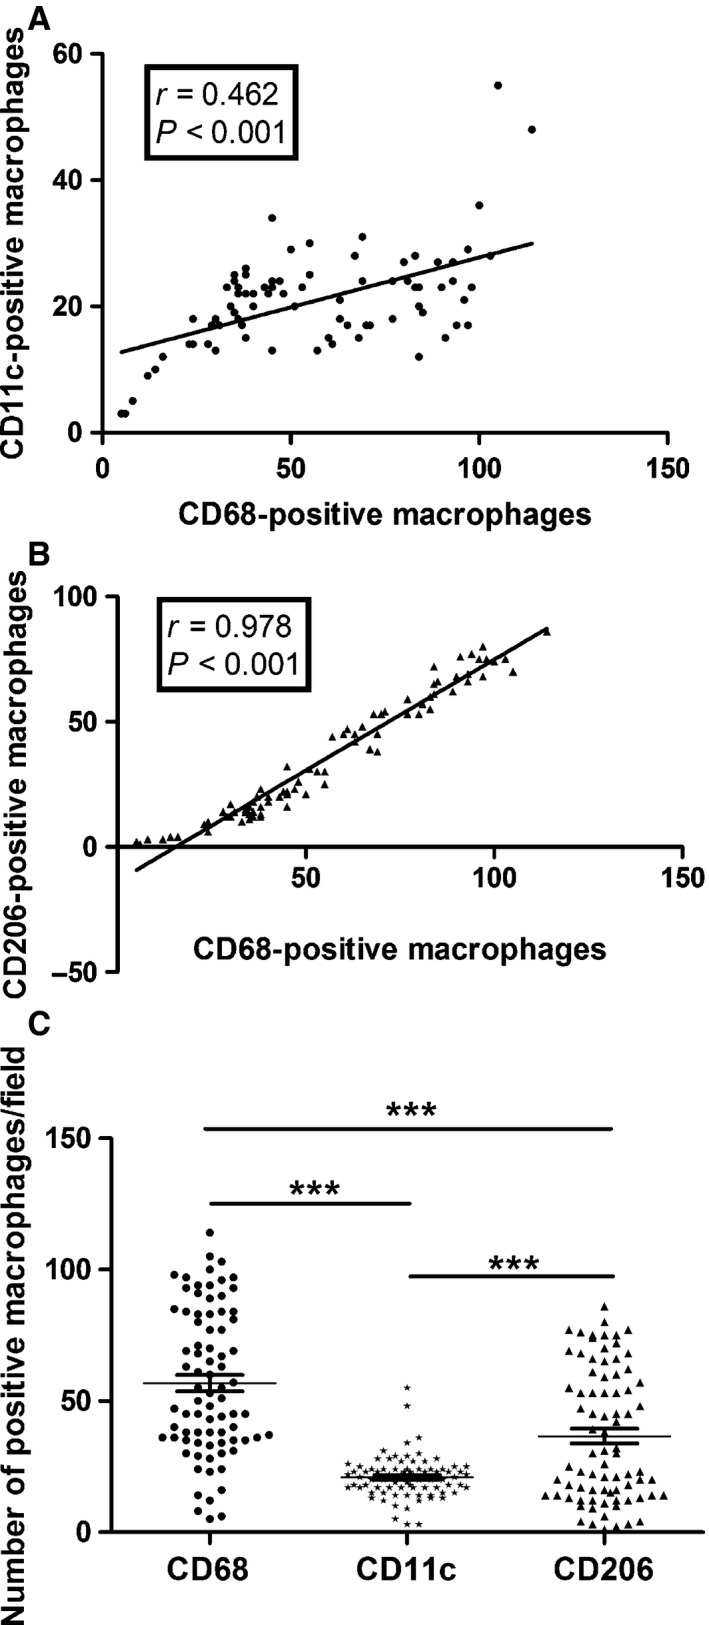
Figure 2.

Distribution of CD68‐positive, CD11c‐positive and CD206‐positive macrophages. (A) Correlations between the distribution of CD68‐positive, CD11c‐positive and CD206‐positive macrophages of each case are shown. The numbers of CD11c‐positive macrophages were significantly correlated with the numbers of CD68‐positive macrophages (r = 0.462, P < 0.001). (B) The numbers of CD206‐positive macrophages were significantly correlated with the numbers of CD68‐positive macrophages (r = 0.978, P < 0.001). (C) The mean number of CD68‐positive macrophages, CD11c‐positive macrophages and CD206‐positive macrophages was 70.05 ± 25.08 (median, 52; range, 5–114), 23.97 ± 9.04 (median, 21; range, 3–55) and 53.45 ± 21.73 (median, 30; range, 1–86), respectively. ***P < 0.001.
