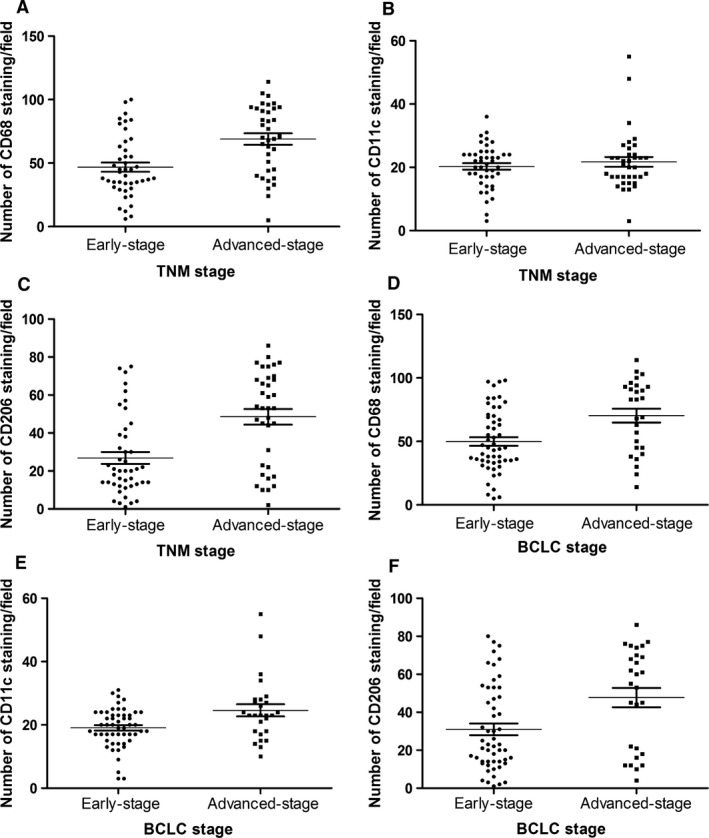
Figure 3.

Polarized macrophage infiltration in different tumour stages. Cell counts of accumulating macrophages. Each point represents the cell count of infiltrating macrophages (/field). Bar indicates mean ± S.D. (A and D) CD68‐positive macrophages in TNM stages and BCLC stages (P < 0.001, P = 0.003, respectively); (B and E) CD11c‐positive macrophages in TNM stages and BCLC stages (P = 0.938, P = 0.015, respectively); (C and F) CD206‐positive macrophages in TNM stages and BCLC stages (P < 0.001, P = 0.011, respectively).
