
Figure 2.
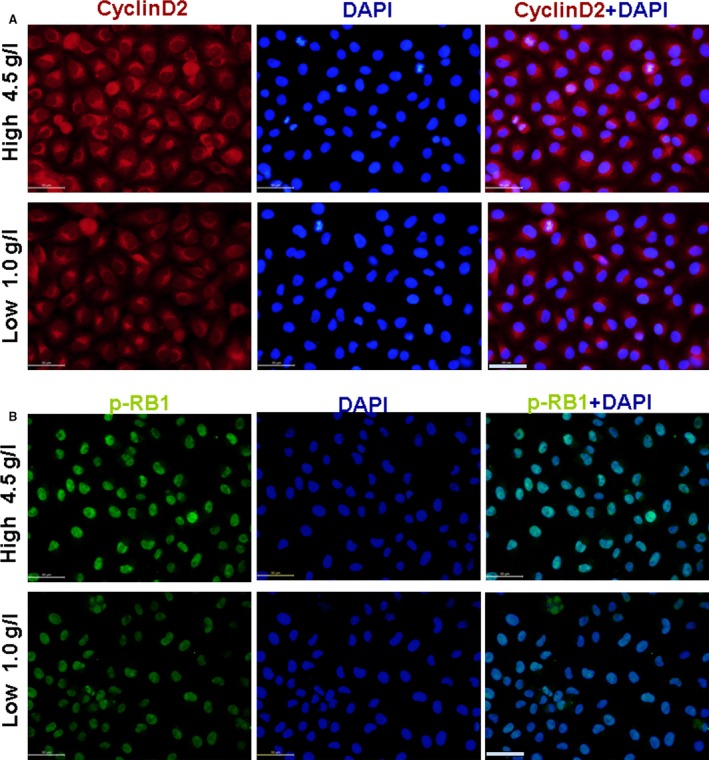
Effect of glucose on cyclin D2 and p‐RB1 expression. (A) Cyclin D2 expression (red). (B) p‐RB1 expression (green). Cyclin D2 and p‐RB1 expression increased in 4.5 g/l glucose‐treated RAOECs compared with control treatment, scale bar = 50 μm.