
Figure 8.
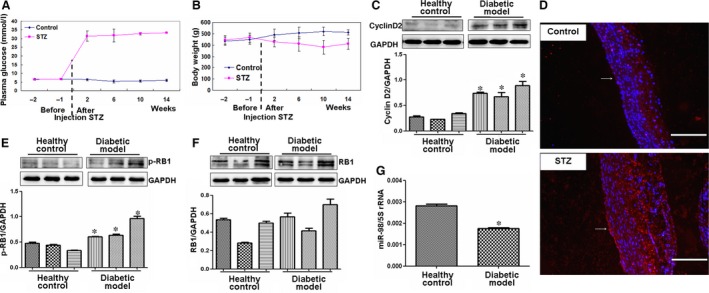
Expression of cyclin D2‐related factors in STZ‐induced diabetic rat model. (A and B) The changes of plasma glucose and bodyweights of STZ rats. Two weeks after STZ treatment, the plasma glucose significantly increased, but the bodyweight significantly reduced in STZ‐induced diabetic rats (n = 15) compared with control rats (n = 10). (C) Cyclin D2 expression. Cyclin D2 levels increased in aortas of diabetic rat model (n = 3) compared with those in healthy control rats (n = 3). *P < 0.05 versus control rats. (D) Cyclin D2 expression (red). Expression of cyclin D2 significantly increased in endothelial cells and smooth muscle cells of STZ‐induced diabetic rat aortas compared with control rats, scale bar = 200 μm. Arrow, indicating the expression of cyclin D2 in endothelial cells. (E and F) p‐RB and RB expressions. p‐RB levels significantly increased in aortas of diabetic rat model (n = 3) compared with those in control rats (n = 3). *P < 0.05 versus control rats. (G) miR‐98 expression decreased in aortas of diabetic rat model (n = 5) than that in healthy control rats (n = 5). *P < 0.05 versus control rats.