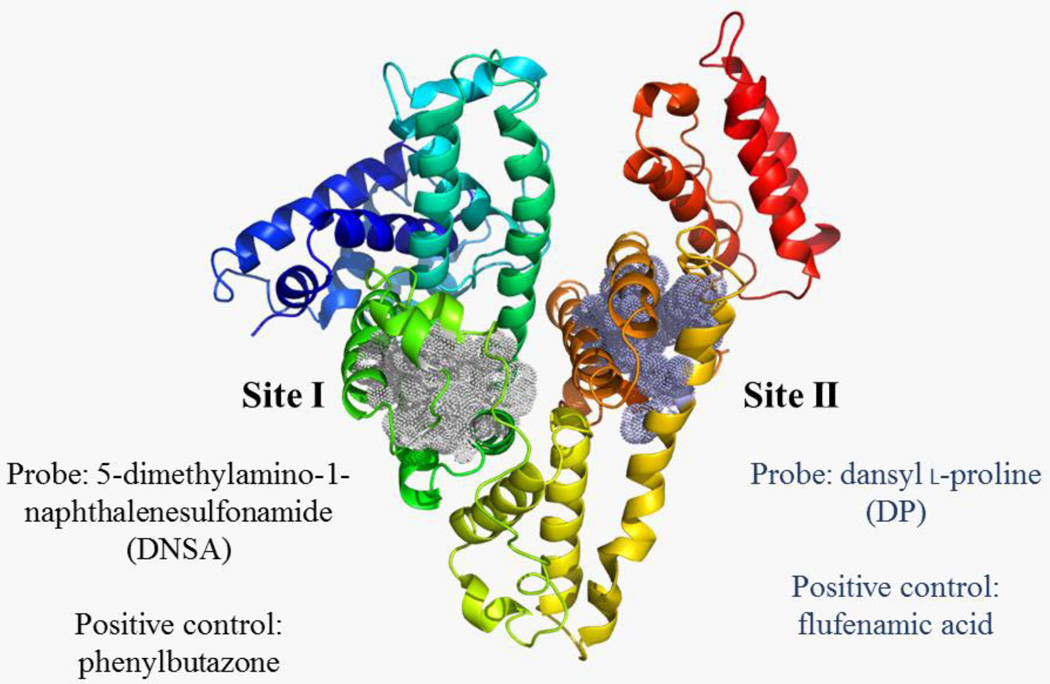
Figure 1.
HSA crystal structure indicating residues that form Sites I and II as well as site-selective fluorescent probes and positive control ligands. The HSA crystal structure (PDB ID: 1UOR) was modified to highlight the binding sites using the PyMOL Molecular Graphics System, Version 1.7.4 Schrödinger, LLC. Residues that surround sites I and II42 have been highlighted in dotted spheres, and the appropriate fluorescent probes and positive control ligands for each site have been annotated.

