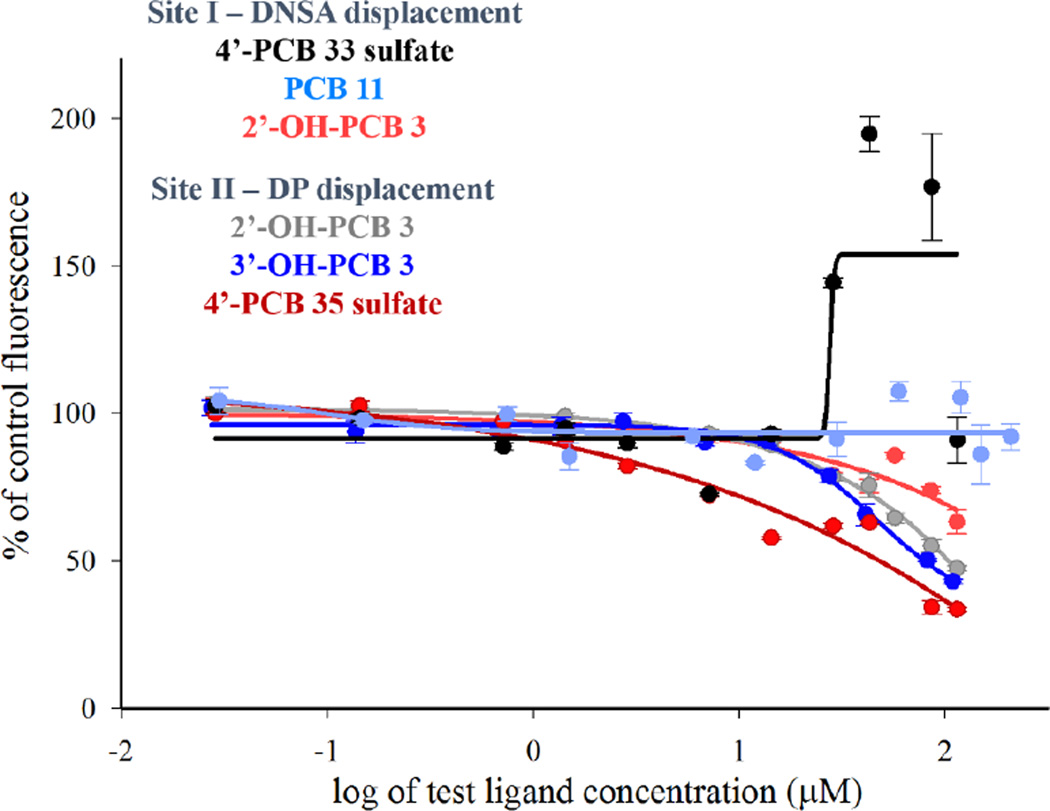
Figure 3.
Binding curves for compounds that did not exhibit binding to either Site I or Site II as determined by site-selective fluorescent probe displacement. Plots are of percent of control fluorescence vs. increasing ligand concentration. Each experiment consists of 10µM HSA and 20µM DNSA or 5µM DP. Data was fit to sigmoidal dose response ligand-binding algorithms (SigmaPlot v.11.0, Systat Software, Chicago, IL) and EC50 values are reported in Figures 4 through 6. Mean ± SE, n=3.

