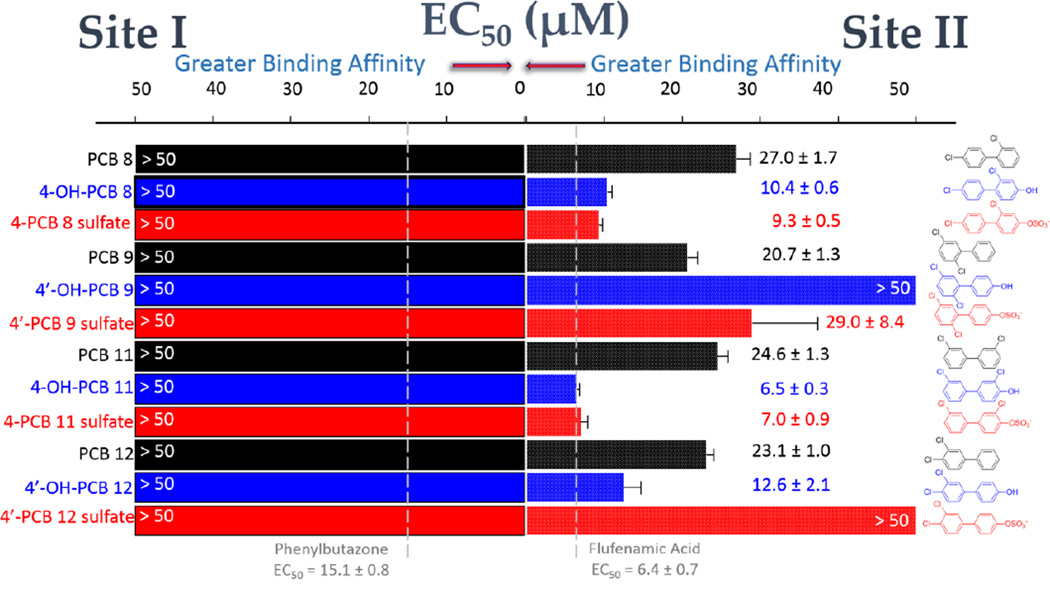
Figure 5.
HSA-binding of dichlorinated PCB congeners and their hydroxylated and sulfated metabolites. Site I binding (DNSA displacement) is shown at the left of the graph and Site II binding (DP displacement) is shown at the right. Color coding is used to differentiate the PCBs (black), OH-PCBs (blue), and PCB sulfates (red). Compound names appear on the left of the graph and the corresponding structure is at the right. EC50 values were obtained as described in Materials and Methods. The vertical dashed lines indicate the EC50 values for the positive control ligands at each site.

