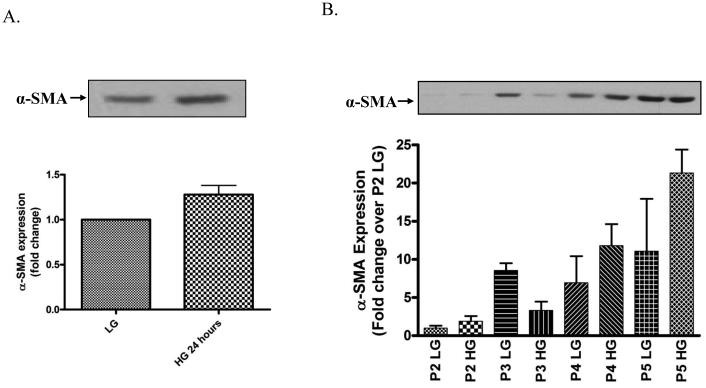
Figure 7. Hyperglycemia accelerates CFs differentiation to myofibroblasts.
Cardiac fibroblasts were cultured in either low glucose (5 mM) or high glucose (25 mM) for the designated time frame and cell lysates were collected and subjected to Western blot analysis for a-SMA expression. Representative Western blot and summary graph for α-SMA expression following a 24 h high glucose incubation (A) and at each cell culture passage (B). Each Western blot was normalized to bands from the napthol blue staining of the same membrane. Each blot and summary graph are mean fold change ± SEM and representative duplicate wells from 2 separate CF preparations (n=2).

