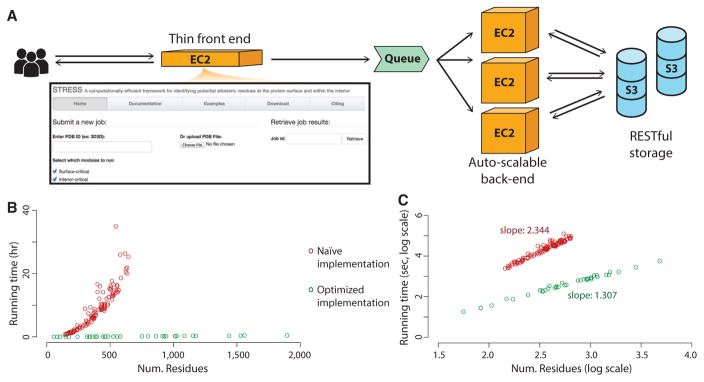
Figure 3. STRESS Web Server Front Page, Running Times, and Server Architecture.
(A) The server enables users to either provide PDB IDs or to upload their own PDB files for proteins of interest. Users may opt to identify surface-critical residues, interior-critical residues, or both. A thin front-end server handles incoming user requests, and more powerful back-end servers perform the heavier algorithmic calculations. The back-end servers are dynamically scalable, making them capable of handling wide fluctuations in user demand. Amazon’s Simple Queue Service is used to coordinate between user requests at the front-end and the back-end compute nodes: when the front-end server receives a request, it adds the job to the queue, and back-end servers pull that job from the queue when ready. Source code is available through Github (https://github.com/gersteinlab/STRESS).
(B) Running times are shown for systems of various sizes. Shown in red are the running times without optimizing for speed, and green shows running times with algorithmic optimization.
(C) The same data represented as a log-log plot. The slopes of these two approaches demonstrate that our algorithm reduces the computational complexity by an order of magnitude. Our speed-optimized algorithm scales at O(n1.3), where n is the number of residues.

