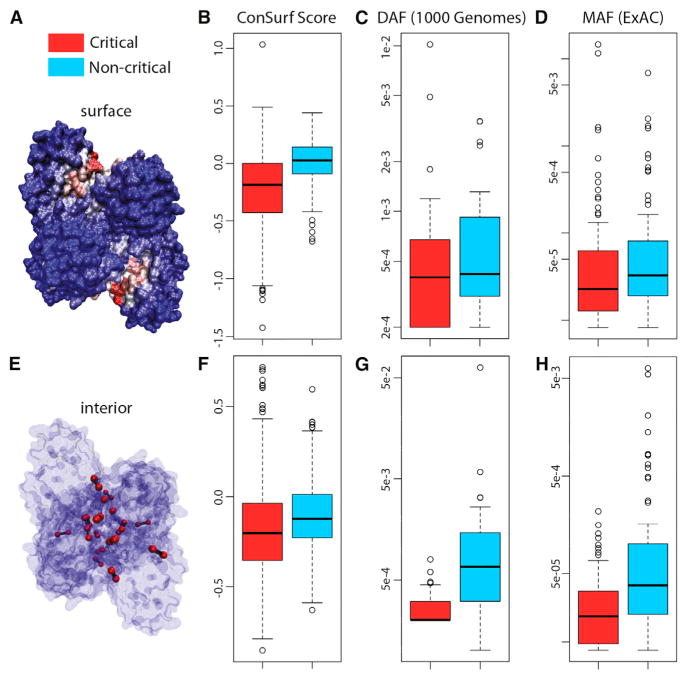
Figure 4. Multiple Metrics and Datasets Reveal that Critical Residues Tend to Be Conserved.
(A–H) Surface- and interior-critical residues (red) in phosphofructokinase (PDB: 3PFK) are given in (A) and (E), respectively. Distributions of cross-species conservation scores, 1,000 Genomes SNV DAF averages, and ExAC SNV MAF averages for surface- and non-critical residue sets are given in (B), (C), and (D), respectively. The same distributions corresponding to interior- and non-critical residue sets are given in (F), (G), and (H), respectively. In (B), mean inter-species conservation scores for surface-critical sets are −0.131, whereas non-critical residue sets with the same degree of burial have a mean score of +0.059 (p < 2.2 × 10⁻¹⁶). In (F), mean inter-species conservation scores for interior-critical sets are −0.179, whereas non-critical residue sets with the same degree of burial have a mean score of −0.102 (p = 3.67 × 10⁻¹¹). In (C), means for surface- and non-critical sets are 9.10 × 10⁻⁴ and 8.34 × 10⁻⁴, respectively (p = 0.309); corresponding means in (D) are 4.09 × 10−04 and 2.26 × 10−04, respectively (p = 1.49 × 10⁻³). In (G), means for interior- and non-critical sets are 2.82 × 10⁻⁴ and 3.12 × 10⁻³, respectively (p = 1.80 × 10−05); corresponding means in (H) are 3.08 × 10−05 and 3.27 × 10−04, respectively (p = 7.98 × 10−09). N = 421, 32, 84, 517, 31, and 90 structures for (B), (C), (D), (F), (G), and (H), respectively. p Values are based on Wilcoxon rank-sum tests. The whiskers extend to the most extreme data point which is no more than 1.5 times the interquartile range from the box. See Supplemental Experimental Procedures for further details. See also Figures S2 and S4.

