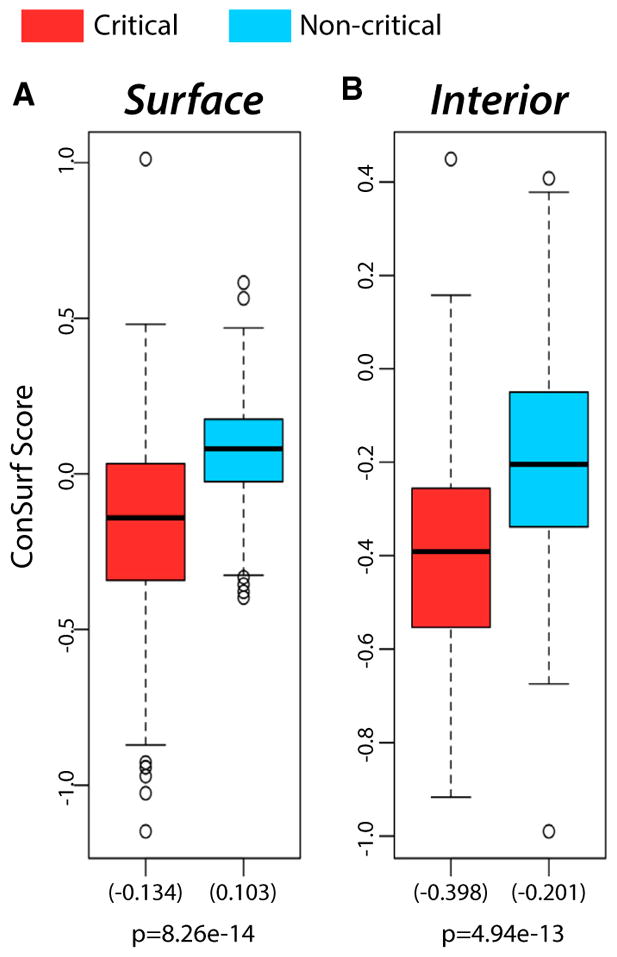
Figure 6. Modeling Protein Conformational Change Through a Direct Use of Crystal Structures from Alternative Conformations using Absolute Conformational Transitions.

(A) Distributions (155 structures) of the mean conservation scores on surface-critical (red) and non-critical residues with the same degree of burial (blue).
(B) Distributions (159 structures) of the mean conservation scores for interior-critical (red) and non-critical residues with the same degree of burial (blue). Mean values are given in parentheses. Results for single-chain proteins are shown, and p values were calculated using a Wilcoxon rank-sum test. See also Figure S3.
The whiskers extend to the most extreme data point which is no more than 1.5 times the interquartile range from the box.
