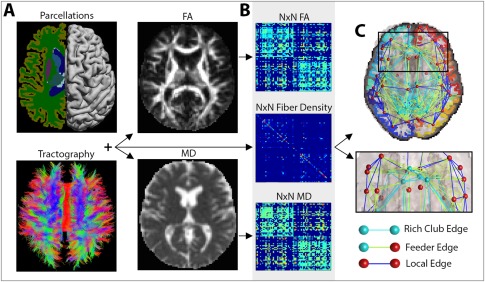
Figure 1.

Image processing steps. (A) A subject's T1‐weighted anatomical image was segmented into N (i.e., 68) distinct ROIs, to define the network nodes in the connectome. These were combined with white matter tractography from the DWIs, fractional anisotropy (FA) and mean diffusivity (MD) maps to determine the number of detected fibers that interconnected a pair of nodes and the FA and MD values associated with them. (B) The interconnecting fibers were stored as N × N connectivity matrices describing the fiber density, average FA and average MD values among connections that linked pairs of nodes in the brain. (C) These connections can be represented as networks of nodes and edges that make up the human connectome. Based on the number and type of nodes that they pass through, edges can be defined as rich club edges that link rich club nodes to other rich club nodes, feeder edges, that link rich club nodes to nonrich club nodes and local edges that link nonrich club nodes to other nonrich club nodes. [Color figure can be viewed in the online issue, which is available at http://wileyonlinelibrary.com.]
