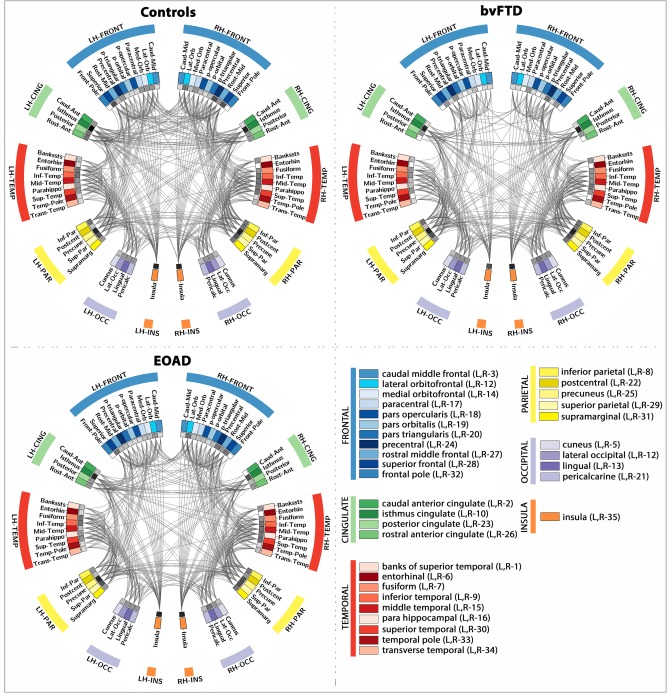
Figure 2.

Connectograms depicting the average patterns of brain connectivity in healthy controls, bvFTD and EOAD patients. This parcellation scheme was based on the Desikan‐Killiany atlas provided with FreeSurfer, which is broken down into 34 cortical ROIs for the left and right hemispheres (LH and RH). Color coded ROIs are listed in the bottom right quadrant, and the nodal degree at each ROI is depicted by the inner ring (gray pallet, with darker squares indicating higher degree). [Color figure can be viewed in the online issue, which is available at http://wileyonlinelibrary.com.]
