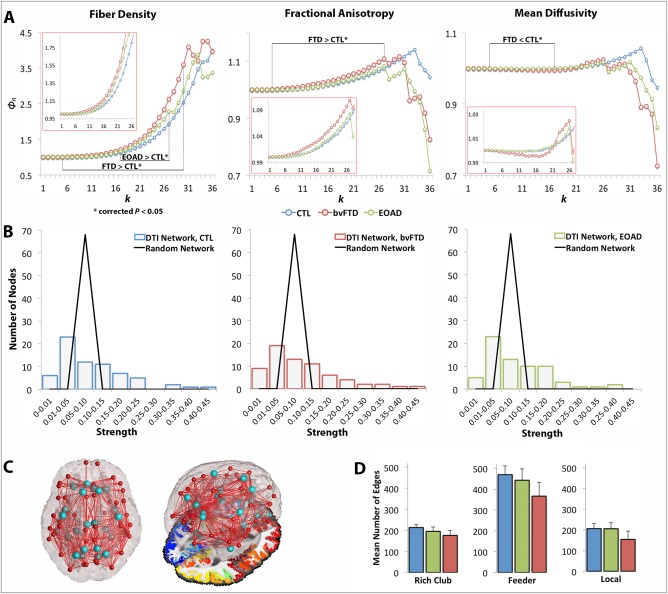
Figure 3.

Rich club curves, strength distribution, rich club nodes and network edges. (A) Average normalized rich club curves (Φn) computed as a function of fiber density (Φw f), FA (Φw FA) and MD connectivity (Φw MD) in healthy controls (blue), bvFTD (red), and EOAD patients (green). The range of significantly (*) altered rich club measures is indicated (i.e., FTD < CTL*), as well as the zoomed in curves for k = 1–26 (in red boxes). bvFTD patients had a higher Φw f and Φw FA across the low and high k‐value regime and lower Φw MD curves in the low regime than seen in controls, reflecting lower levels of connectivity in the brain connectome; EOAD had a higher Φw f curve than controls in the high k‐value regime. (B) Fat‐tailed distribution of strength in the DTI networks of each diagnostic group and corresponding random networks indicating higher probability of hubs than in the random distribution. (C) Brain networks delineating 13 distinct regions (26 bilateral) included in the rich club network (light blue); figure to the right shows the 3D glass brain projected on top of an axial slice with FreeSurfer parcellations. (D) Average network connections and their standard deviation across the three diagnostic groups were defined as rich club, feeder, and local edges. All three classes of connections were lower in the diagnostic groups, relative to controls, except the local connections in EOAD patients. [Color figure can be viewed in the online issue, which is available at http://wileyonlinelibrary.com.]
