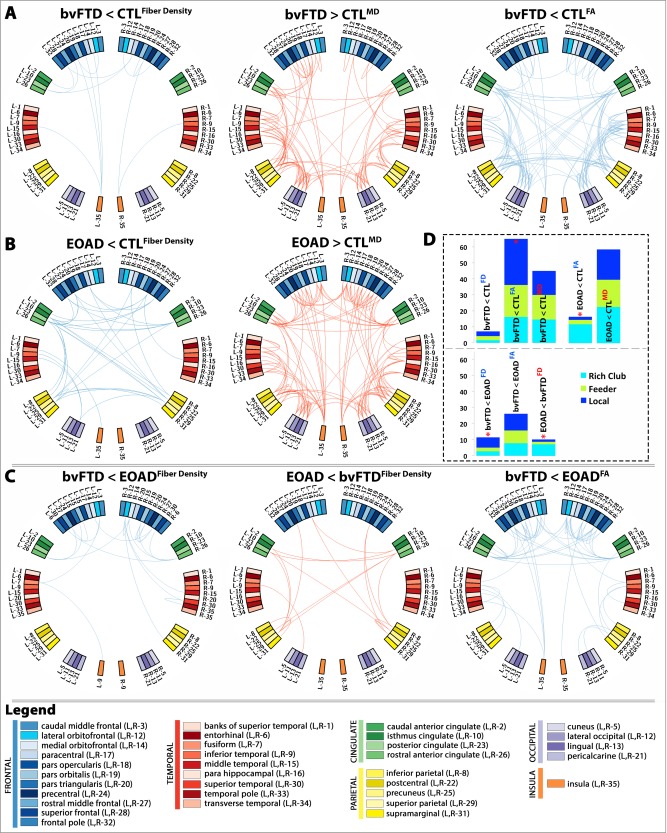
Figure 5.

Diagnostic group differences in the N × N connectivity matrices for fiber density (FD), FA and MD between: (A) bvFTD and healthy controls; (B) EOAD and healthy controls; and (C) bvFTD and EOAD. Blue edges indicate decreasing patterns for corresponding measures, while red edges indicate increasing patterns—all suggestive of alterations in connectivity. (D) Proportion (%, y‐axis) of significantly altered connections (100% × observed/expected) illustrated as rich club, feeder, or local edges. In bvFTD, the proportion of local edges was more affected among the altered connections when compared to controls and separately, EOAD; while in EOAD, the proportion of rich club edges was more affected among the altered connections when compared to controls and bvFTD. “<” indicates that a particular diagnostic group presented with more alterations than the other; “*” denotes where a significantly higher proportion of edges than expected was altered as described by the χ 2 test. [Color figure can be viewed in the online issue, which is available at http://wileyonlinelibrary.com.]
