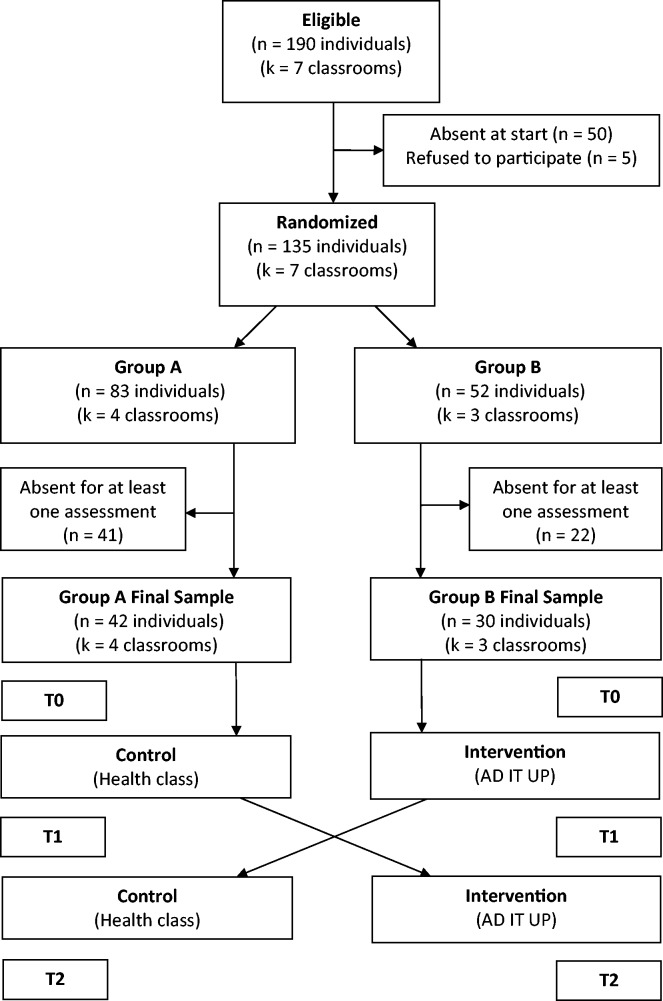
Fig. 1.
As is indicated in the flow diagram, 135 from the initially 190 eligible students were randomized to either Group A or Group B. The final sample consisted of 72 individuals, 42 of whom were from Group A in 4 classrooms and 30 of whom were in Group B in 3 classrooms. T0, T1 and T2 represent the baseline, initial follow-up and final follow-up data collections.

