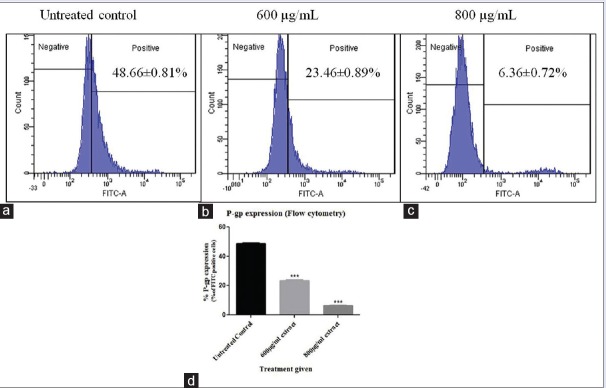
Figure 4.
P-glycoprotein expressing (fluorescein isothiocyanate positive) OVCAR3 cells represented as histograms for (a) untreated cells (b) 600 μg/mL extract treatment (c) 800 μg/mL extract treatment and (d) graphical representation of statistical significance. Statistical analysis was carried out using one-way ANOVA followed by Dunnett's posttest, and results were significant at P < 0.05 as compared to the untreated control

