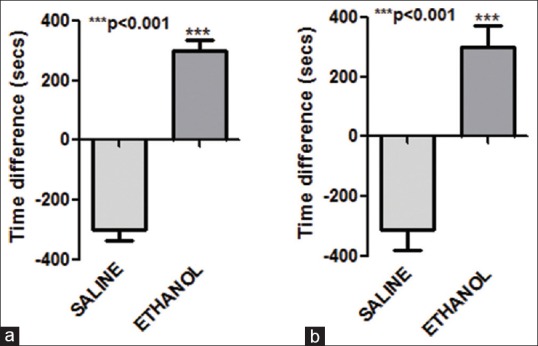
Figure 1.

Conditioned place preference on ethanol administration. Time spent in alcohol and saline administration chamber on (a) day 11 (b) day 12 by control and ethanol-treated group. On both days, ethanol-treated animals showed significant increase in (P < 0.001) time spent in ethanol-paired alcohol compared to saline-paired chamber. Values represent mean ± standard error of the mean n = 7
