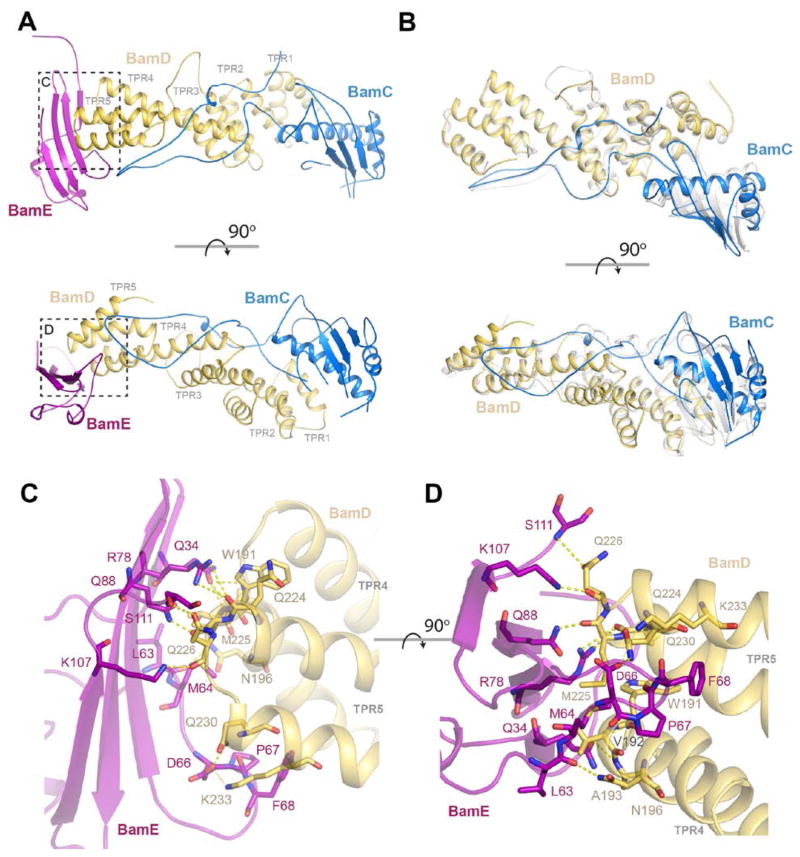
Fig. 2. Interactions of BamC and BamE with BamD.
A. The complex structure of BamCDE is shown here with BamD in gold, BamC in blue, and BamE in purple. The TPR domains of BamD are indicated. The bottom panel is rotated 90º along the x-axis relative to the top. B. The interactions between BamC and BamD are nearly the same as that observed in the previously reported crystal structure (PDB ID 3TGO) with an RMSD of 1.25 Å across both chains. The bottom panel is rotated 90º along the x-axis relative to the top. C. View showing the interactions of BamE with BamD TPR4 and 5 through an extensive interface with a buried surface area of ~800 Å2, containing a mix of hydrogen bonds, salt bridges, and hydrophobic interactions. D. A view from the top which is rotated 90º along the x-axis to further illustrate the extensive binding interface.

