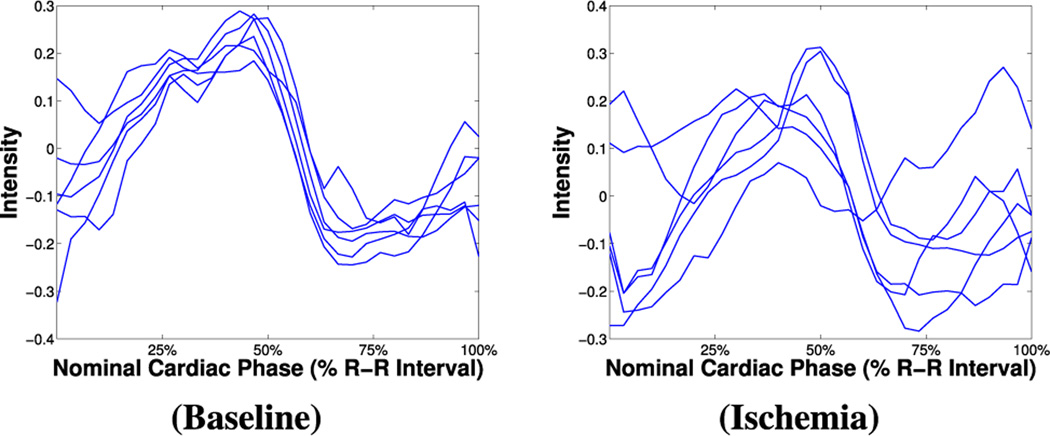
Fig. 1.
BOLD signal intensity time series (as segmental averages of six different radial segments across the images, ie., frames, of the cine movie) extracted from rest CP–BOLD MRI data of the same subject, at baseline (left) and under ischemia (right). (CP–BOLD is ECG-triggered and first and last time points correspond to diastole. Time series have been normalized according to the process described in Section II-B for ease of visualization.)

