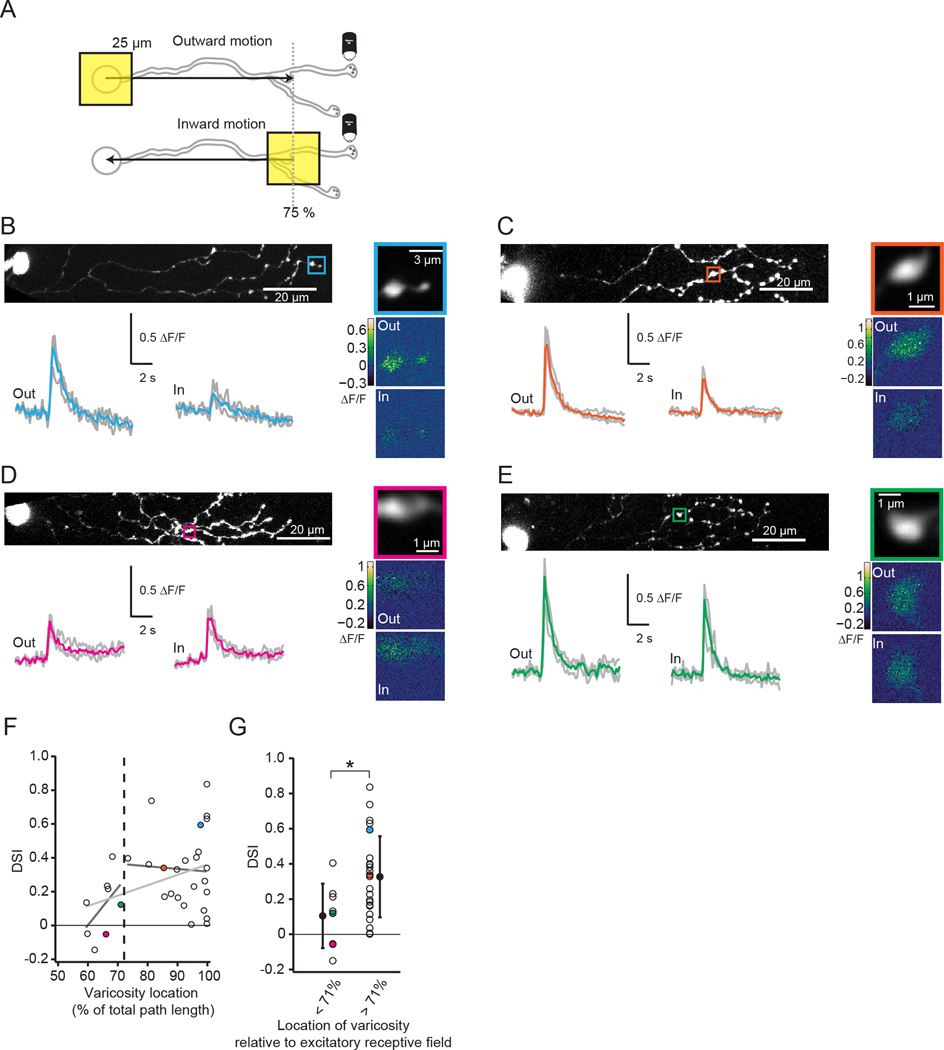
Figure 6. DS of varicosities depends on varicosity location.
A) Schematic showing imaging of a distal varicosity from an OGB-1-filled SAC presented with a 25 µm square of light moving either outward from the soma toward the distal dendrites or inward from the distal dendrites toward the soma. The stimulus was restricted to 75% of the dendritic radius (grey dotted line).
B–E Four examples of Ca2+ responses to stimulation with moving squares. B is an example of an outward-preferring varicosity near the end of the dendrite. C is an example of a more proximal varicosity that is strongly direction selective for outward motion. D is an example of a slightly inward-preferring varicosity. E is an example of an untuned varicosity.
Top left: 2-photon fluorescence image of SAC filled with OGB-1 (z-projection). The square indicates the imaged varicosity. The soma is on the left.
Top right: Average intensity projection of the imaged varicosity during the entire experiment.
Bottom left: ΔF/F (grey) following visual stimulation with a 25 µm moving square either outward from the soma toward the end of the dendrites (“out”) or inward from the distal dendrites toward the soma (“in”). Colored traces: averages of the three trials.
Bottom right: Maximal ΔF/F responses of the imaged varicosities to a single presentation of the moving square moving outward (“out”) or inward (“in”) along the dendritic radius.
F) Direction selective index (DSI) for varicosities from 33 cells in response to inward vs. outward moving squares (black circles) as a function of the varicosity location normalized to the path length of the dendrite. A positive value for the DSI indicates a larger response for outward motion compared to inward motion. Colored dots are the DSIs for the example cells in B–E. Black dotted line: average length of the excitatory receptive field predicted from uncaging (see Fig. 3). Light grey line is a linear fit to the entire data set (slope = 0.006, r2 = 0.134) while dark grey lines are fits to the varicosities inside vs. outside of the receptive field detected from uncaging (inside: slope = 0.022, r2=0.248; outside: slope = −0.002, r2 = 0.002).
G) DSI for varicosities from 33 cells (black circles) sorted by whether they are within (< 71%; 8 cells) or outside (> 71%; 25 cells) of the mean excitatory receptive field predicted from uncaging (black dotted line in F). Colored dots are the DSIs for the example cells in B–E. Open circles = means ;error bars = S.D. * = p < 0.05, Student’s t-test.
See also Figure S6.

