
Figure 4.
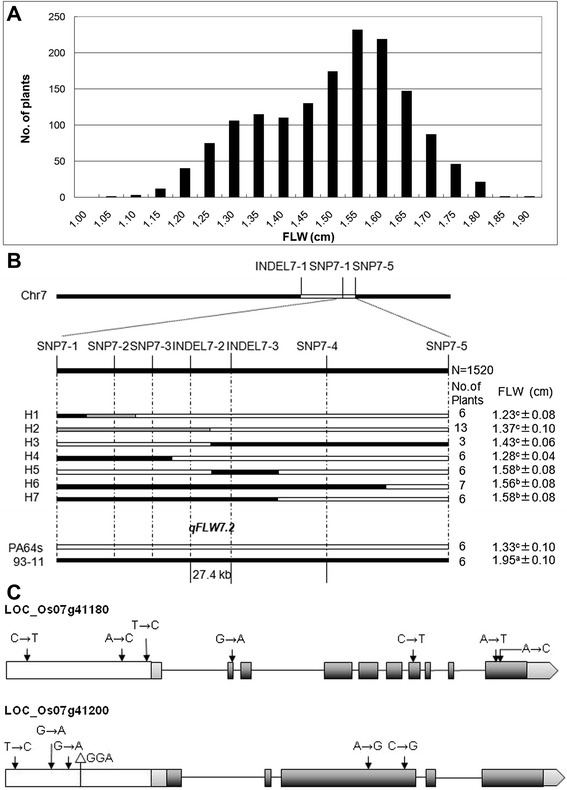
Fine mapping of qFLW7.2 for FLW. A. Distribution of FLW in the F2 population derived from RHL. B. qFLW7.2 was narrowed down to a 27.4 kb interval defined by markers INDEL7-2 and INDEL 7–3. Values represent means ± SD. Gray represents heterotype. The superscript letters (a, b and c) indicate significant differences in the trait of the recombinants compared with two parents at a level of 0.01. C. Structure and mutated sites of two candidate genes. Grey boxes represent exons.