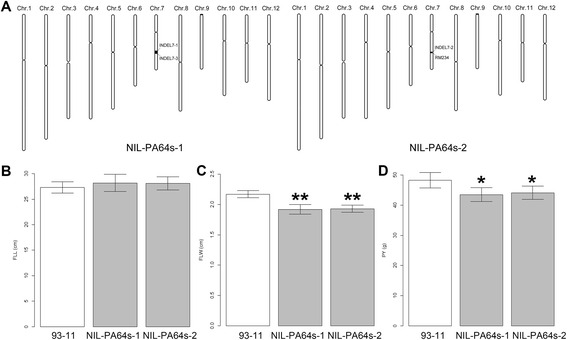
Figure 6.

Comparison in FLL, FLW and PY of NIL-PA64s-1, NIL-PA64s-2 and 93-11. A. Schematic graph of chromosomes of NIL-PA64s-1 and NIL-PA64s-2. B, C, D. Comparison of FLL, FLW and PY between NIL-PA64s-1, NIL-PA64s-2 and 93–11. NIL-PA64s-1 and NIL-PA64s-2, carrying homozygous alleles of PA64s in the target QTL region (black box) between INDEL7-1 and INDEL7-3, INDEL7-2 and RM234, respectively, were developed from one CSSL with 93–11 background. Values represent means ± SD of three plants.
