
Fig. 4.
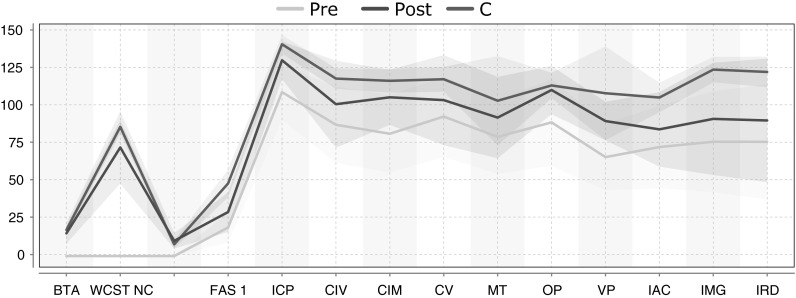
Average assessment values and variance regions for controls and for patients before (Pre) and after treatment start (Post) for 16 variables: despite some overlaps, lines and regions of patients are mostly distinct from those of the controls. (Color figure online)