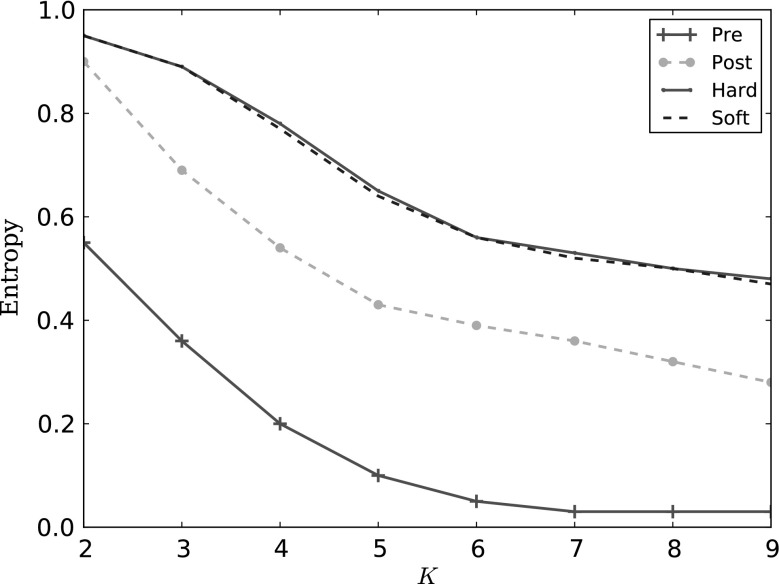
Fig. 6.
Controls clustered with the patients before treatment (Pre: red), after treatment start (Post: yellow), with the Hard projection (green) and the Soft one (blue dashed): entropy drops as the number of clusters increases, but has higher (better) values for the projected instantiations, indicating that these are closer to the controls

