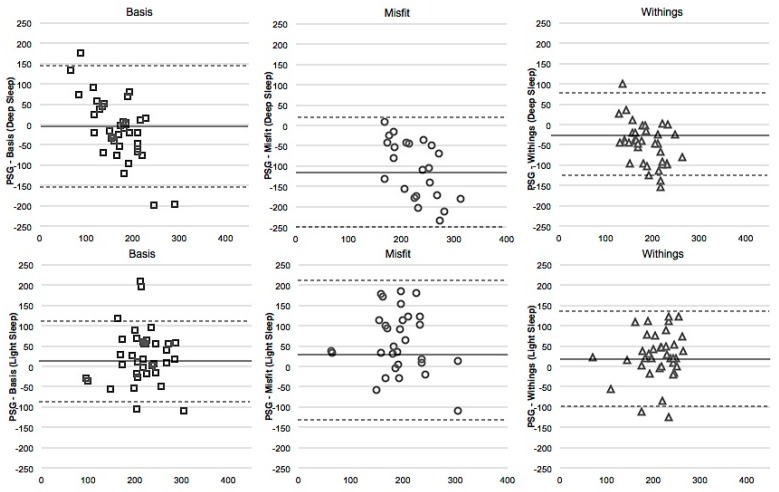
Figure 3.
Bland-Altmann plots for Deep Sleep (top row) and Light Sleep (bottom row), each in minutes, for the Basis, the Misfit, and the Withings (adjusted values). The x-axis is the mean of the two devices, and the y-axis represents PSG minus the device. Dotted line represents two standard deviations from the mean.

